
A Clearer Picture of Wellbore Mass Balance During Managed Pressure Operations
The Need for Improved Wellbore Monitoring
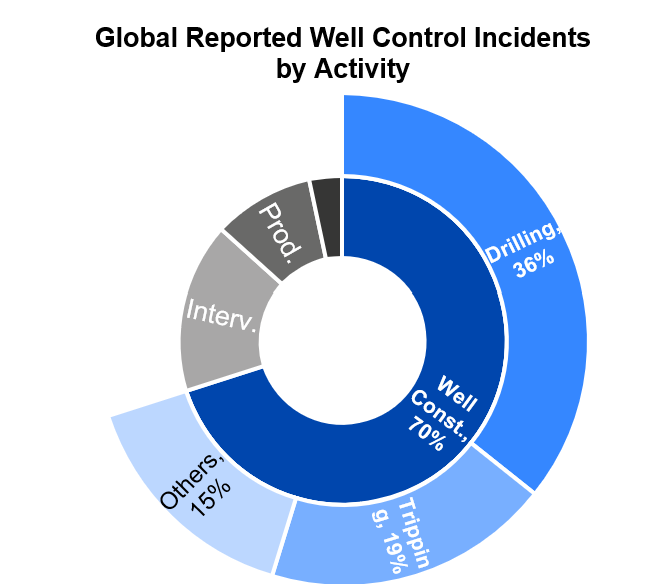
Well construction remains a major contributor to well control incidents, accounting for approximately 70% of globally reported cases (Fig. 1, Gillard et al., 2022). For Managed Pressure Drilling (MPD) operations, this makes reliable and timely monitoring particularly important. MPD systems provide a significant improvement over conventional pit-volume monitoring by continuously comparing the flow entering and leaving the well (Fig. 2). Using Coriolis flowmeters and pump-derived flow-in measurements, this delta flow approach can identify relatively small deviations from the expected wellbore mass balance and, through time integration, generate a Virtual Trip Tank (VTT) volume (Fig. 2).
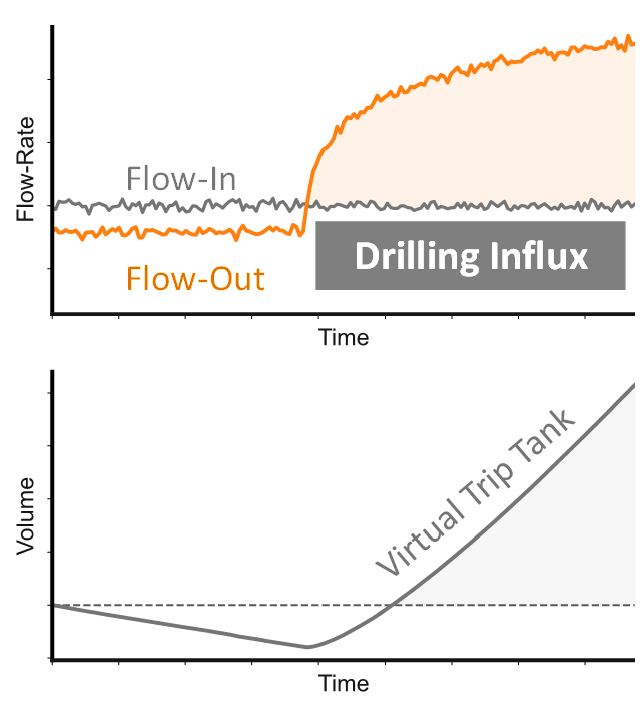
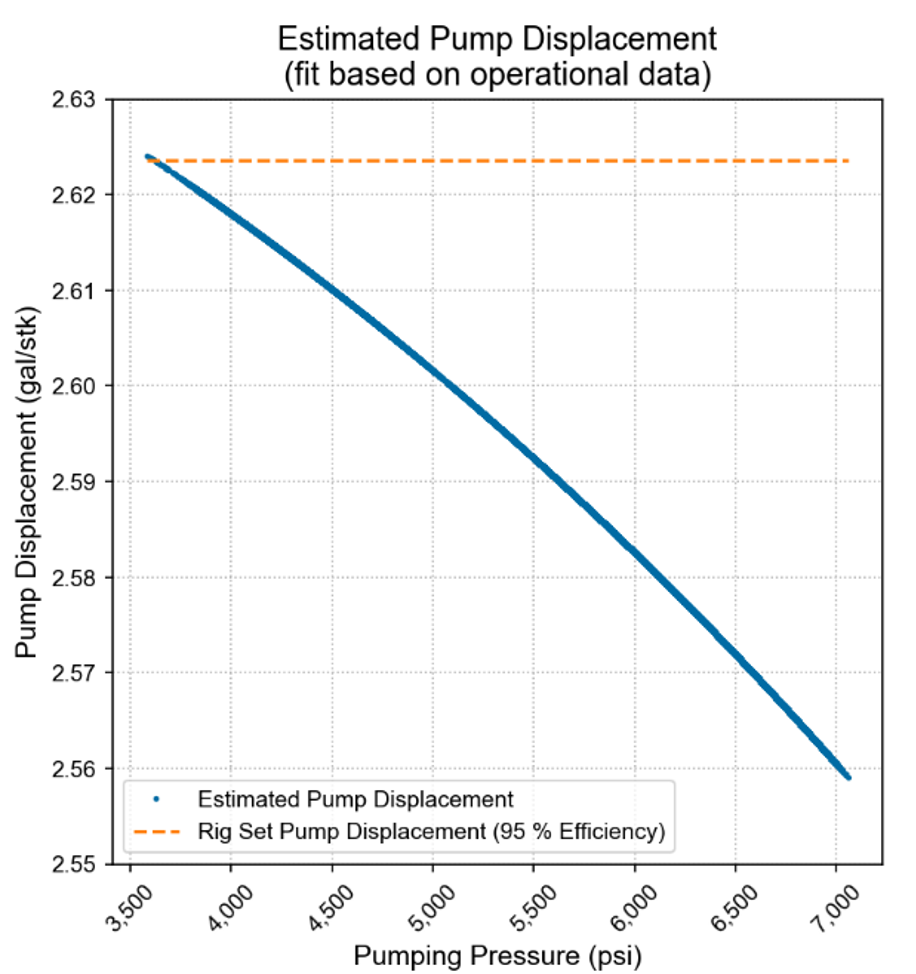
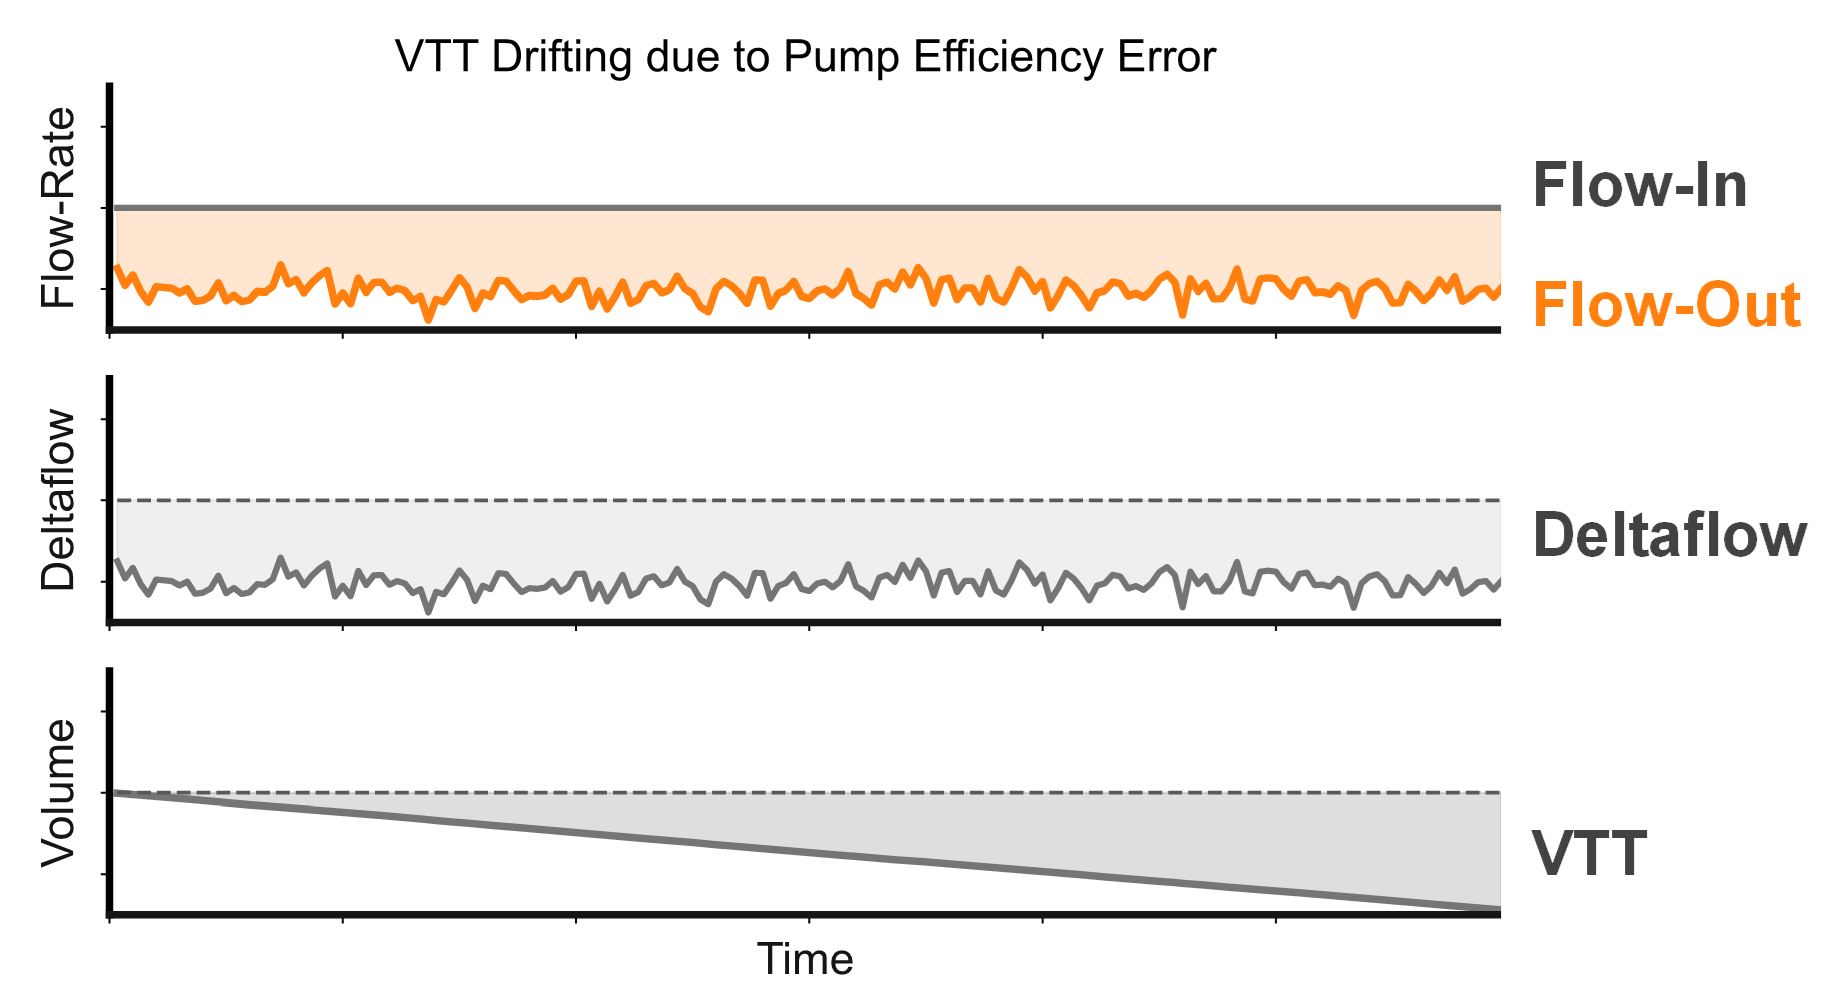
Under steady-state conditions, the concept is highly effective. An influx, for example, produces a characteristic divergence between flow-in and flow-out that can be detected before a significant volume accumulates. However, the accuracy of the resulting VTT depends directly on the quality and calibration of the flow measurements. Flow-in is commonly estimated from pump displacement and a fixed efficiency, while actual pump performance changes with operating pressure and fluid properties (Fig. 3). This introduces systematic drift that can create apparent gains or losses even when the well is stable (Fig. 4).
The challenge becomes even greater during tripping. Pipe movement and continuous wellbore backfilling generate cyclic flow responses that can resemble influx and loss signatures (Fig. 5). As a result, delta flow-based monitoring can produce misleading indications during trips, limiting its practical application and forcing crews to fall back on conventional trip tanks and manual tripping tallies. These provide a useful reference, but typically only at discrete intervals, are interrupted by measurement resets, and rely primarily on volume thresholds rather than the behavior of the signal itself.
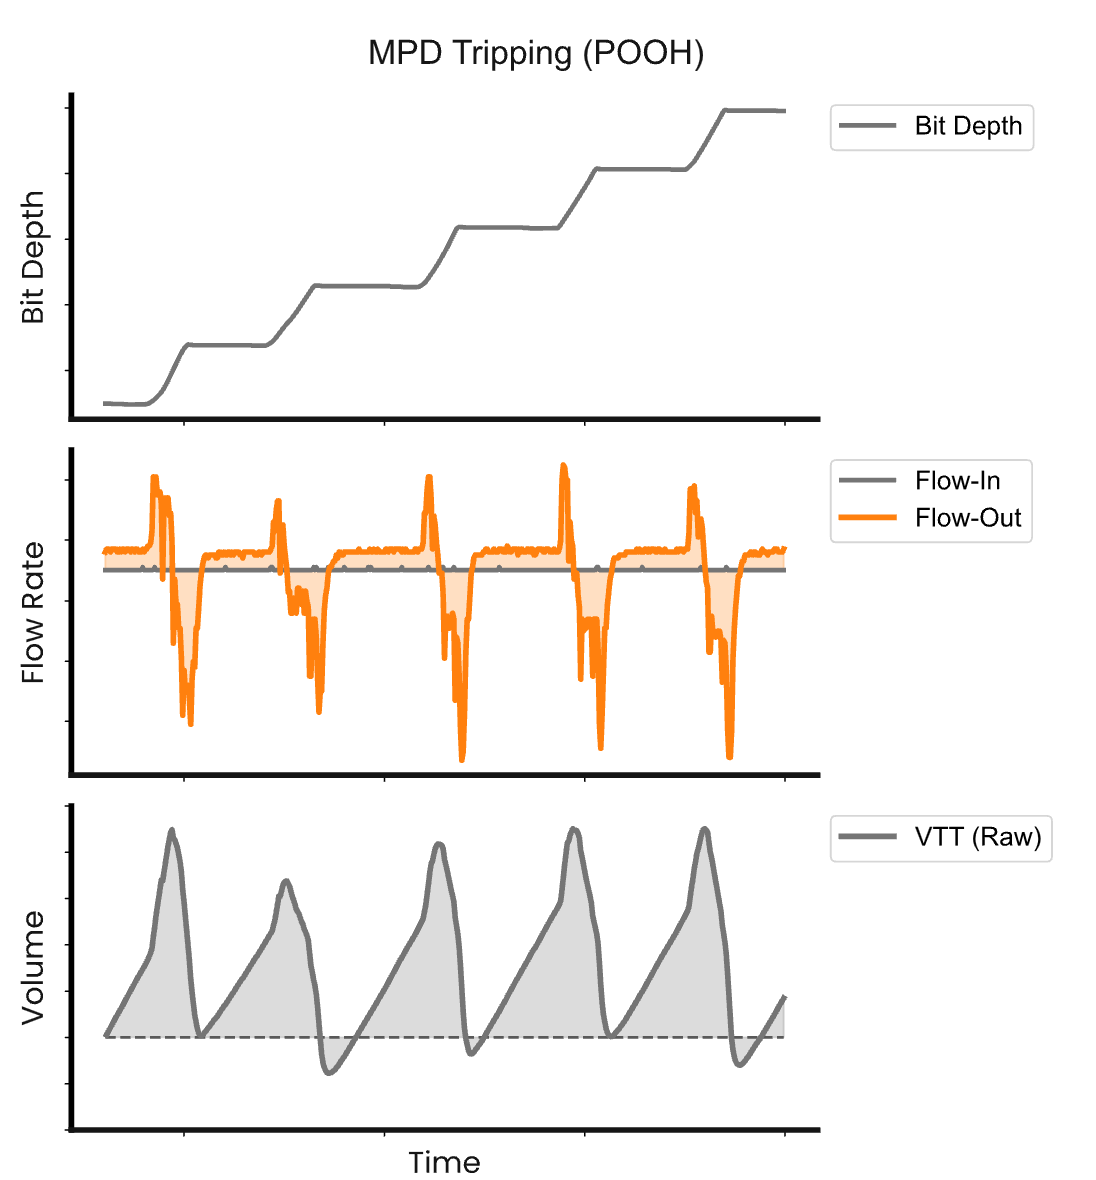
This limitation is increasingly important as MPD is applied to more complex wells with narrower operating pressure margins. As the pressure window becomes smaller, the required precision and reliability of wellbore monitoring increase accordingly. The opportunity, therefore, is not simply to measure flow more accurately, but to transform existing MPD measurements into a continuous, interpretable wellbore volume reference that remains useful during dynamic operations such as tripping.
An Enhanced Flow and Volume Monitoring Approach
The developed solution builds on the measurements already available in modern MPD systems, without requiring additional hardware or sensors at the rig. The application automatically calibrates and corrects the existing flow measurements, providing a more consistent indication of wellbore mass-balance deviations.
A key objective was to extend VTT monitoring beyond the steady-state conditions where conventional deltaflow-based methods perform best. By accounting for the characteristic flow response associated with pipe movement, the application can continuously track wellbore volume during tripping and generate a stand-by-stand tripping reference. This provides substantially finer resolution than conventional tripping tallies, which typically record a measurement only every several stands or approximately 500 ft. The continuous reference also avoids the periodic resets that interrupt the cumulative volume trend and can mask smaller deviations occurring between measurements.
The application further extends monitoring beyond simple volume and threshold comparisons by examining the behavior and patterns of the response signal. This creates an additional layer for identifying localized deviations that may otherwise be masked within the overall wellbore volume trend. Rather than replacing existing MPD event-detection methods, this approach is intended to complement them with a more granular and behavior-based representation of the well response.
The concept was validated using historical operational data from MPD wells. The corrected VTT reproduced the measured tripping-volume trend with strong agreement while providing substantially greater temporal and operational resolution than the conventional reference. The results demonstrate how existing MPD measurements can be transformed into a continuous wellbore volume reference, providing the foundation for more consistent tripping monitoring and, ultimately, more advanced automated event detection.
Flow-In Calibration
The first step in the workflow is to establish a reliable flow-in measurement. The methodology is based on mass conservation: under stable conditions, with no influx, losses, or other activity affecting the wellbore, flow-in should match flow-out. Because the Coriolis flow-out measurement provides the direct measurement of fluid leaving the well, it is used as the reference to calibrate the flow-in signal.
The workflow first identifies suitable operating periods through automated rig-state classification. The available data are then screened based on the agreement between flow-in and flow-out to isolate the most consistent periods for calibration. Finally, these selected periods are used to generate a pump calibration curve, which is applied to produce a corrected flow-in measurement throughout the operation.

This correction addresses the systematic drift introduced when pump displacement or efficiency is assumed to remain constant while actual pump performance changes with operating conditions. During drilling, for example, an approximately 5 gal/min offset between flow-in and flow-out generated a persistent negative deltaflow and caused the VTT to incorrectly indicate losses under stable conditions (Fig. 7). After calibration, the flow measurements are brought into closer agreement, and the VTT drift is substantially reduced.
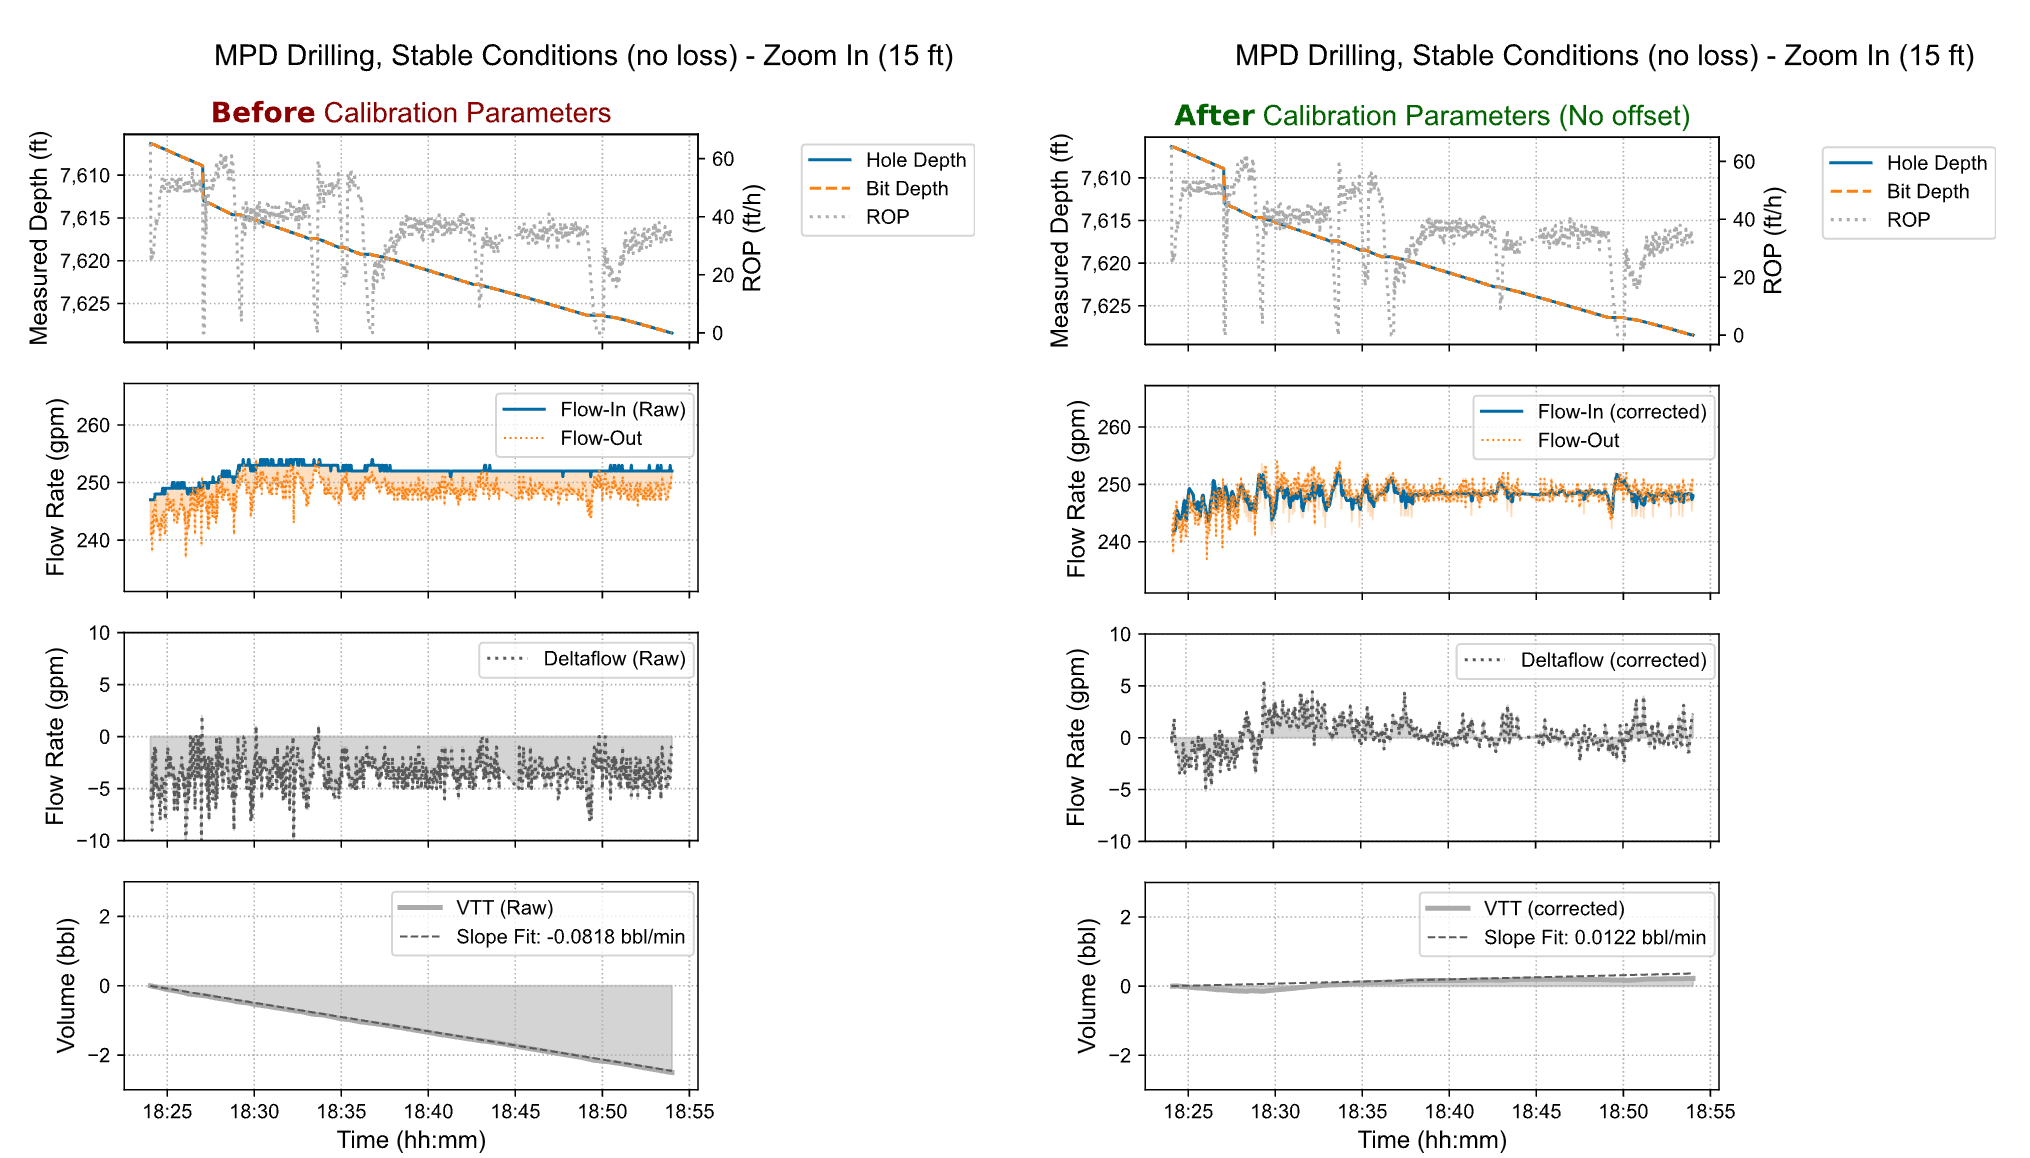
The improvement is particularly important during tripping operations. Uncorrected flow offsets can accumulate as pipe is removed, producing an apparent influx trend even when the well is behaving as expected. For tripping operations, the difference between the expected pipe-displacement volume and the measured VTT can also be tracked as ΔVTT, as defined in Equation (1).
This provides a direct measure of deviation from the expected tripping response. A positive trend indicates that the measured wellbore volume is lower than expected, which can appear as an influx (kick), while a negative trend indicates a higher measured volume, consistent with a loss. The final track therefore highlights whether the measured VTT is progressively diverging from the expected pipe-displacement trend.
In one pull-out-of-hole (POOH) example, the systematic drift reached approximately 0.14 bbl/min, equivalent to roughly 8 bbl over one hour. After calibration, this drift was eliminated and the VTT followed the expected downward tripping-volume trend.
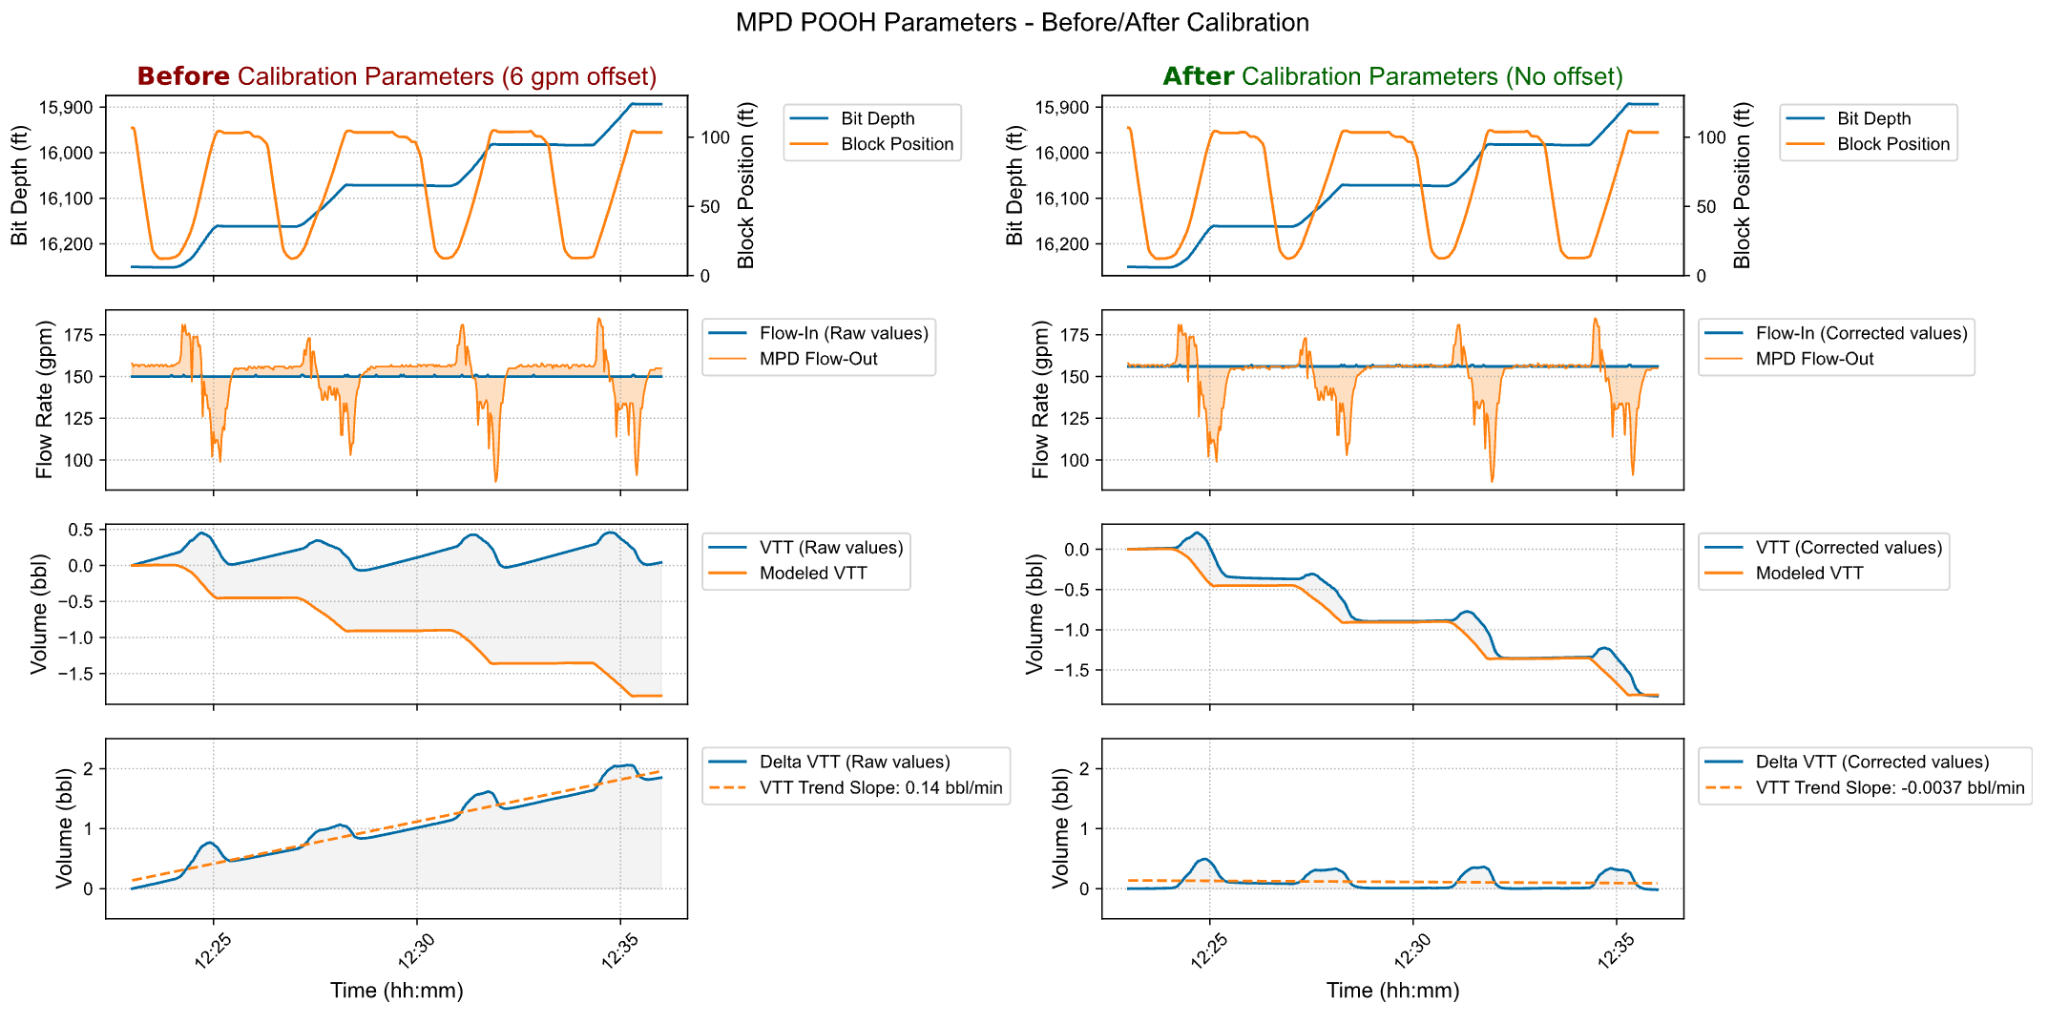
The resulting corrected VTT provides the reliable volume reference required for the next stage of the application: continuous, stand-by-stand monitoring of drilling & tripping operations and identification of deviations from the expected wellbore response.
VTT App for Real-Time Monitoring
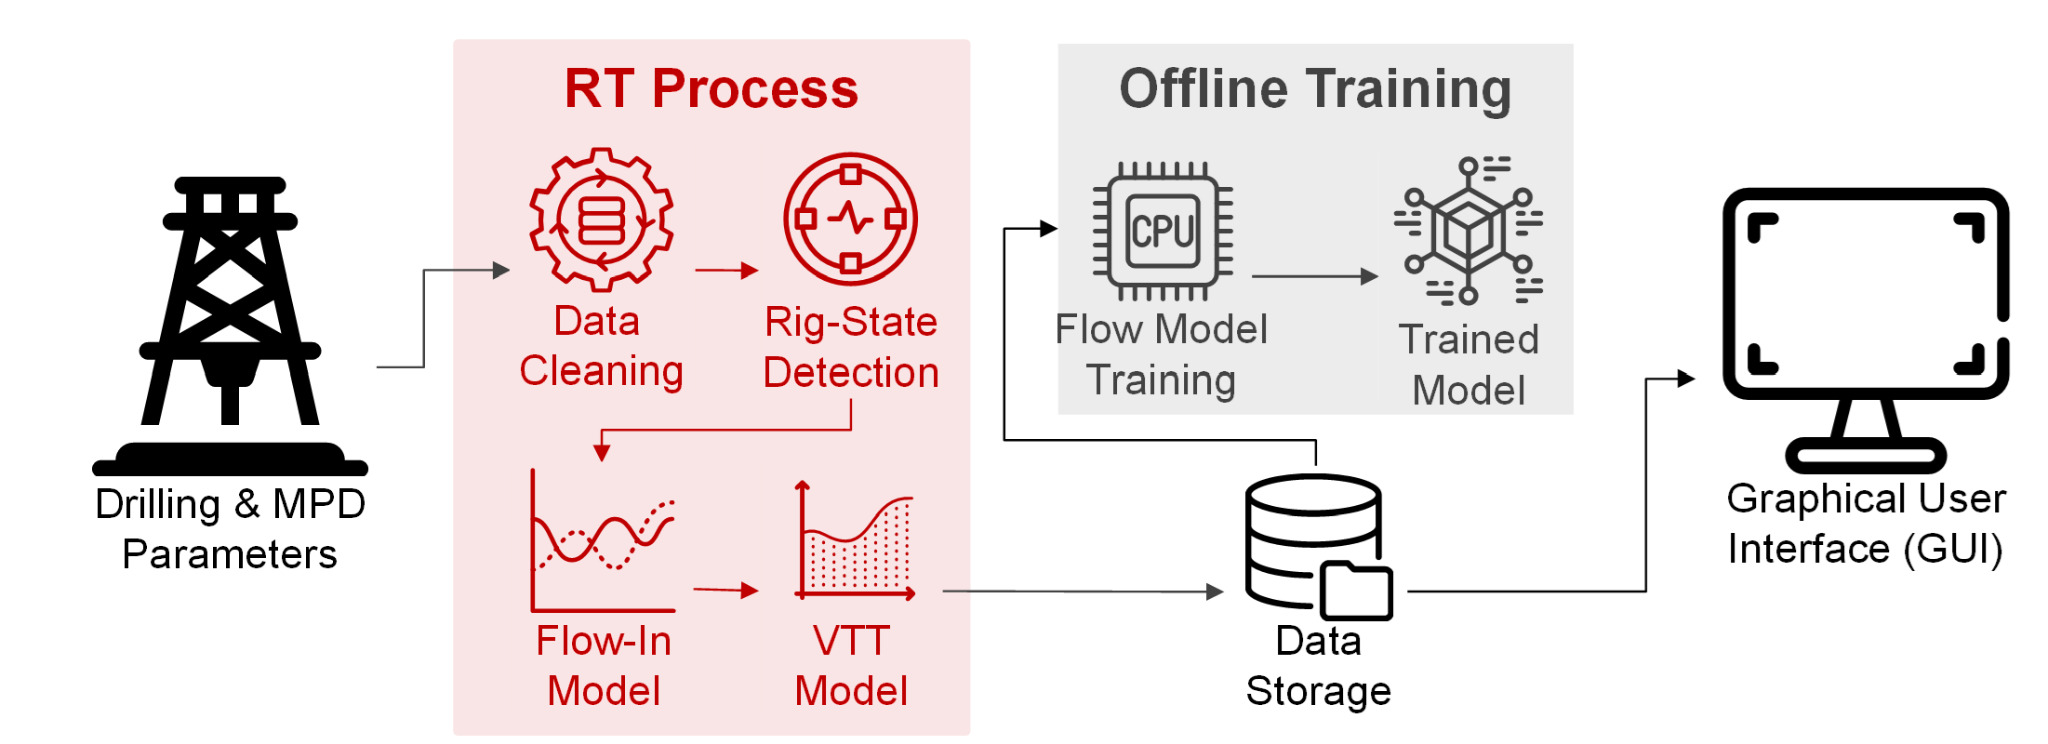
The VTT application was developed as a two-stage architecture combining a real-time processing pipeline with an offline flow-model training workflow (Fig. 9). The real-time process consumes rig data, performs data cleaning and preprocessing, identifies the current rig state, and estimates the corrected Flow-In and cumulative VTT volume. These processed parameters are stored and streamed to the rig-side graphical user interface (GUI). In parallel, the offline training workflow uses the labeled operational data generated by the real-time process to train and update the flow-response model for subsequent deployment.
Real-Time Monitoring Interface
The real-time monitoring interface provides an integrated view of the parameters required to monitor tripping operations (Fig. 10). The main panel displays bit depth and block position, Flow-In and Flow-Out rates, calculated VTT volume, and the cumulative difference between the measured and expected volume response. A stand-by-stand tripping tally is generated automatically using the in-slips detection to segment the operation into individual stands.
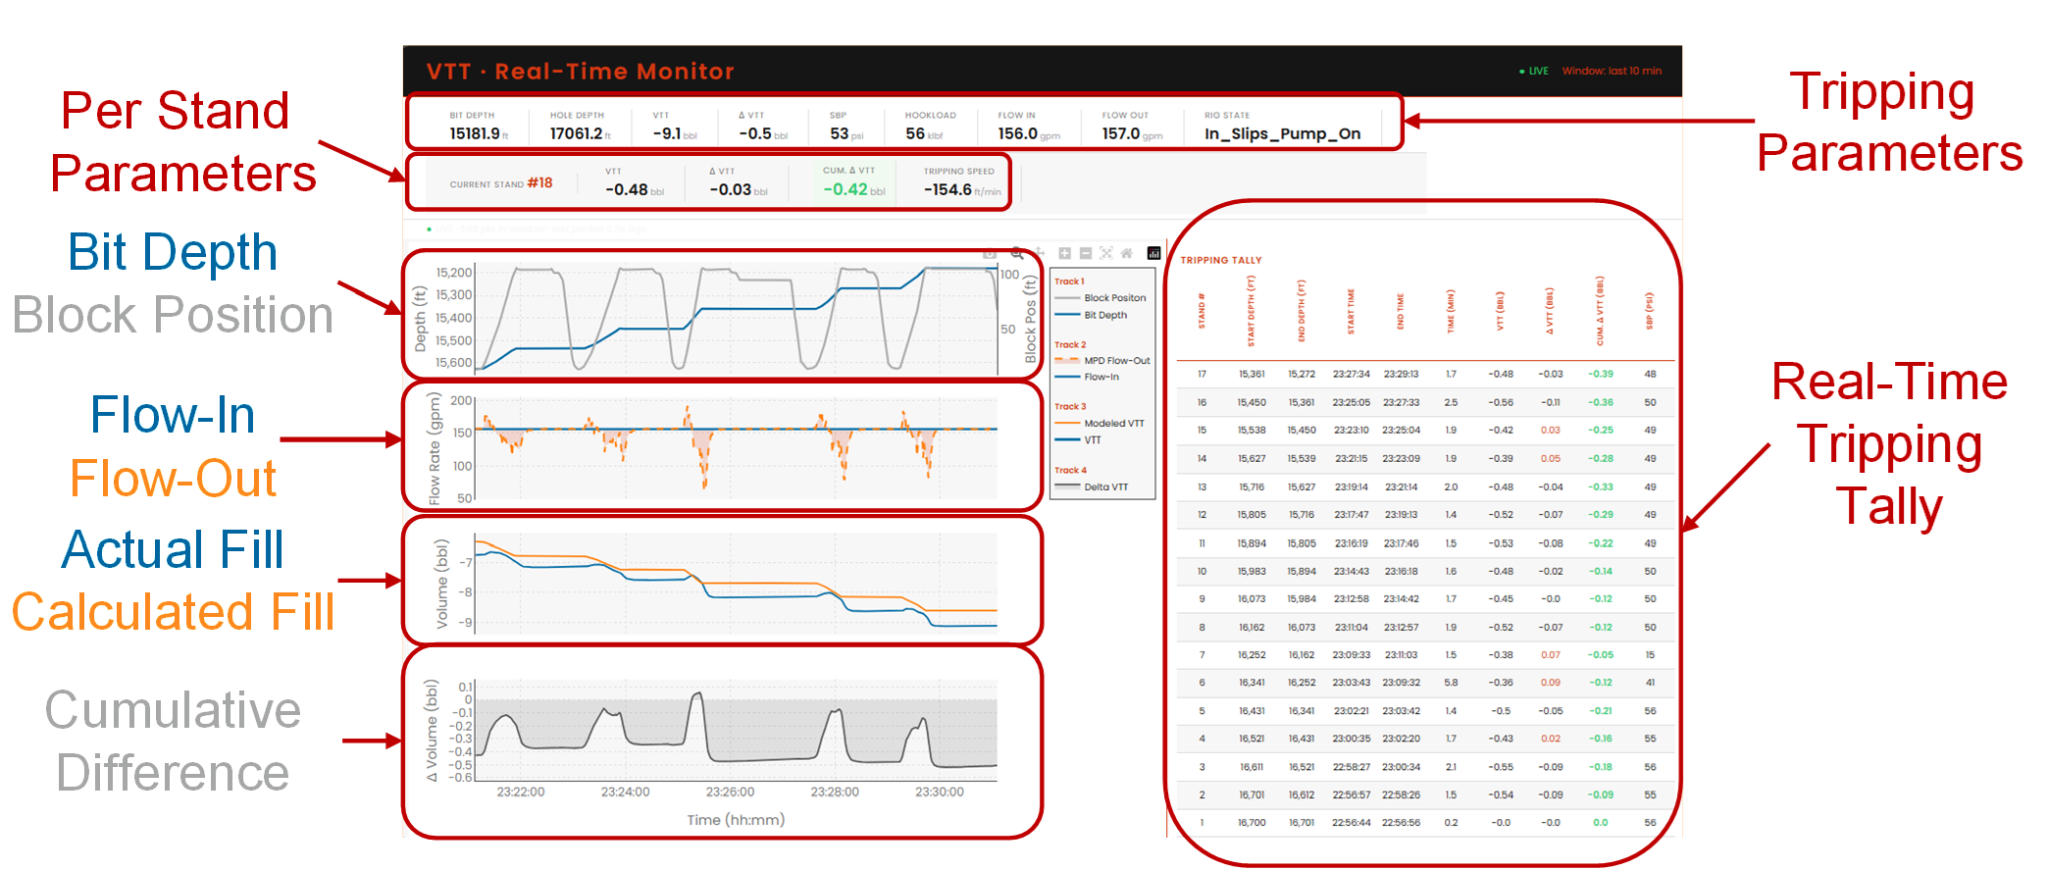
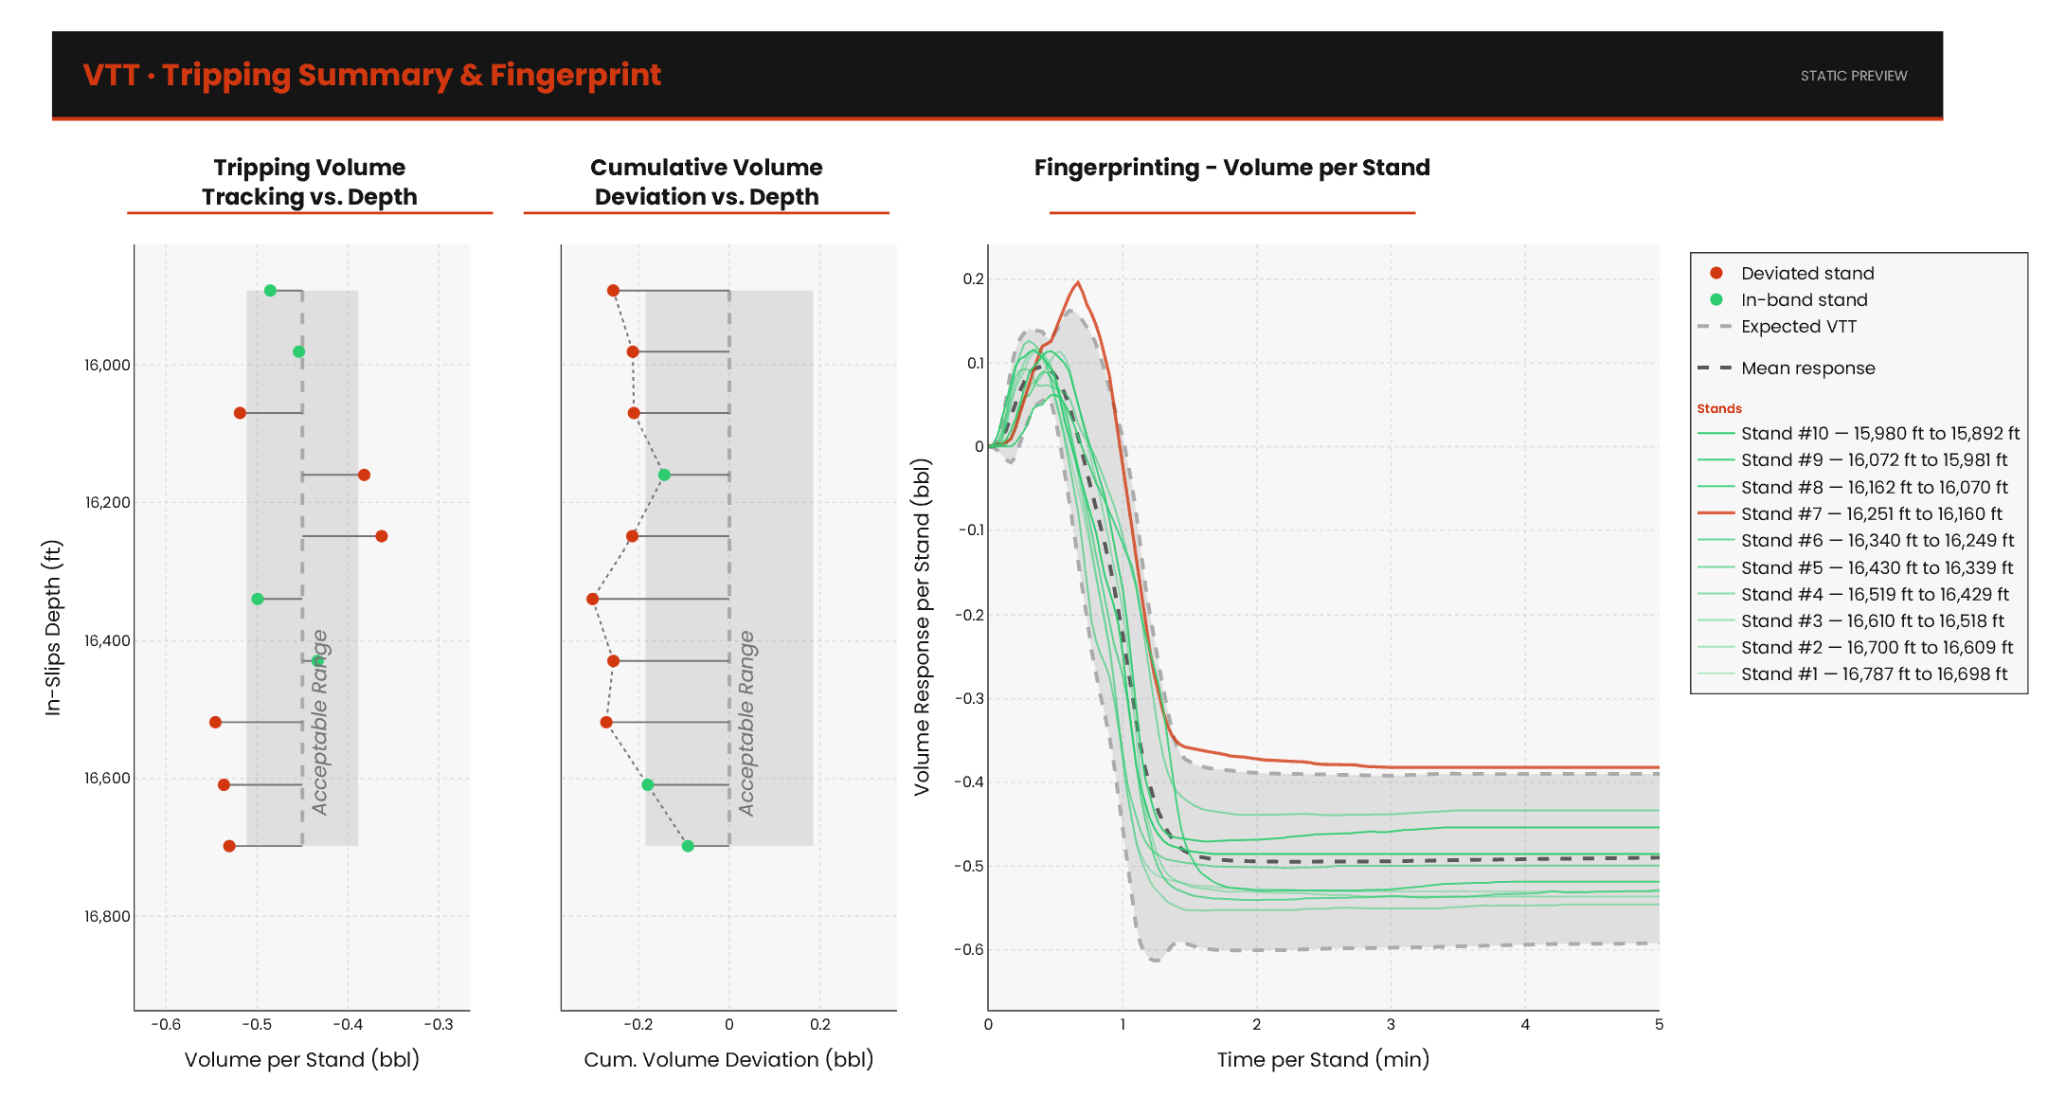
The upper panel provides the current rig state and the parameters associated with the active stand, allowing the operator to monitor the operation continuously while retaining stand-level resolution. A complementary summary and fingerprinting view provides the cumulative tripping volume and deviation for each stand, together with the corresponding volume-response fingerprint (Fig. 11). These fingerprints characterize the expected response of each tripping cycle and provide a visual means of identifying deviations from normal behavior.
Tripping Volume Validation
Historical MPD datasets were selected for offline validation based on the availability of reliable tripping measurements. Because continuous pit-volume data were not available, the historical tripping tally was used as the reference measurement. Fig. 12 compares the cumulative VTT volume with the measured volume during a POOH operation. The VTT closely follows the reference response throughout the SOOH interval, with both measurements consistently capturing a loss trend of approximately 10 bbl/1,000 ft.
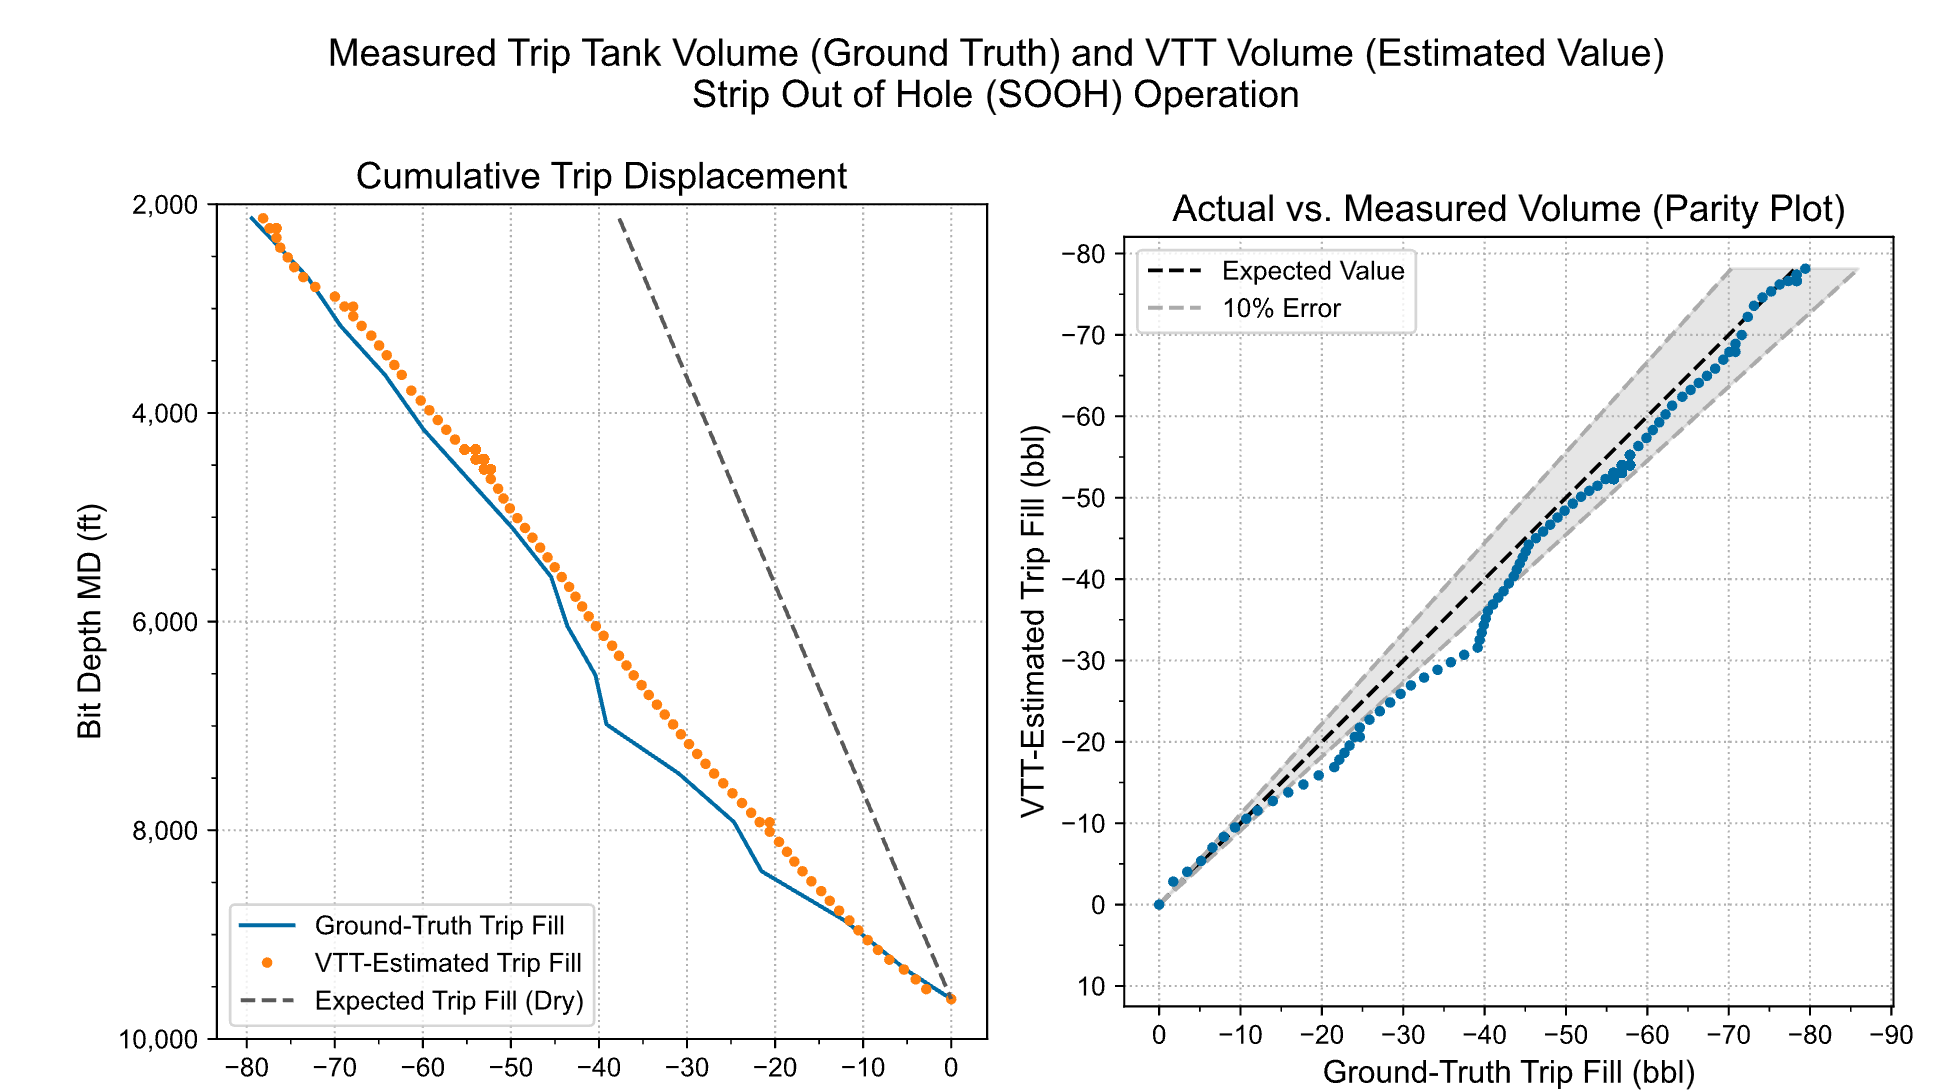
The agreement is further supported by the correlation metrics summarized in Table 1, including Pearson and Spearman correlation coefficients and R². The parity plot shows that most predictions fall within ±10% of the reference. The remaining discrepancy is primarily attributed to limitations in the reference data, which were recorded only every five stands and with relatively low measurement precision. Additional uncertainty was introduced by repeated volume resets, while the flow model had not been retrained specifically for the demonstration rig.
| Metric | Value |
|---|---|
| Pearson r | 1.00 |
| Spearman r | 0.99 |
| R-squared | 0.97 |
| MAPE (%) | 7.4 |
| MAE (bbl) | 3.0 |
| StDev of Error (bbl) | 1.5 |
Event-Detection Preview
An initial event-detection framework was also implemented to complement conventional volume-threshold monitoring. The approach uses signal-pattern recognition to identify localized deviations in the volume response, with the objective of improving detection sensitivity and response time while reducing false alarms.
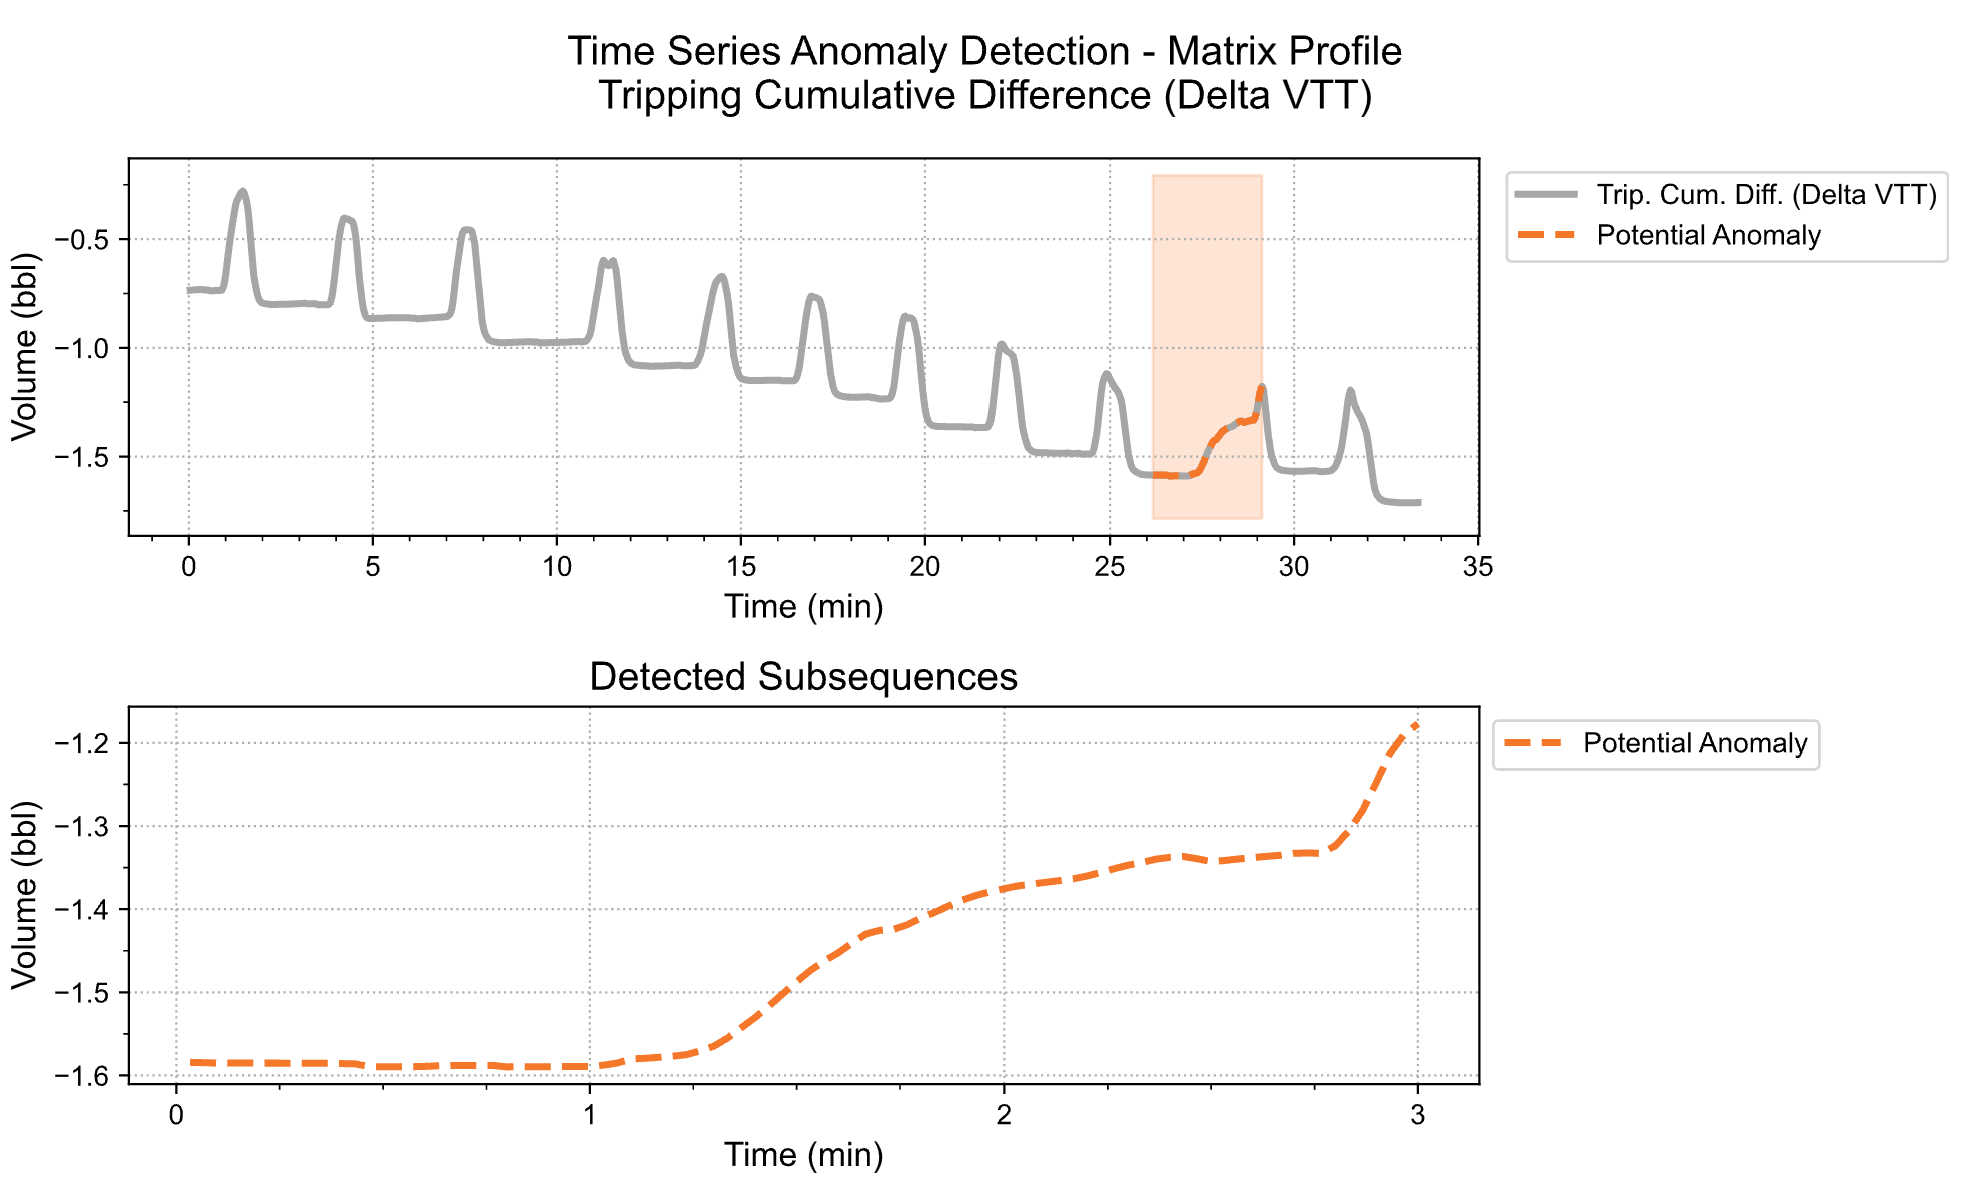
Fig. 13 illustrates the application of a Matrix Profile to the cumulative VTT difference during tripping. The signal captures the individual tripping cycles while exhibiting an overall loss trend of approximately −3.6 bbl/h. Within this trend, the algorithm identifies a localized 0.25-bbl anomaly between approximately 26 and 29 minutes. The deviation is highlighted in both the cumulative-difference and detected subsequence tracks and corresponds to an abnormal response within a single tripping cycle. Because the overall loss trend remains unchanged, this localized deviation could be difficult to identify using conventional volume-based thresholds alone, demonstrating the potential of signal-pattern analysis as a complementary event-detection approach.
Conclusions and Way Forward
An automated Flow-In calibration methodology was developed and demonstrated using real operational data, reducing VTT measurement error by 98% and systematic drift by 85% in the evaluated dataset. By automating the calibration process, operator-dependent adjustments were minimized, providing a more consistent and repeatable volume reference for tripping monitoring.
| Error Metric | Unit | VTT (Raw) | VTT (Corrected) | Improvement (%) |
|---|---|---|---|---|
| RMSE | bbl | 5.73 | 0.15 | 97.4 |
| Mean Error (Bias) | bbl | -5.69 | 0.09 | 98.4 |
| Error Std. Dev. | bbl | 0.71 | 0.12 | 83.2 |
| Drift Slope | bbl/h | -0.17 | 0.024 | 85.0 |
| R-squared | — | 0.00 | 0.94 | 93.7 |
A portable VTT application was subsequently developed to provide real-time corrected parameters, automated stand-by-stand tripping tallies, and visualization of the cumulative tripping trend. The fingerprinting workflow provides an additional baseline for characterizing the expected volume response of individual stands. Offline validation demonstrated good agreement with available tripping measurements despite limitations in the reference data. An initial pattern-recognition framework further demonstrated the potential to identify localized deviations that may remain masked within an overall loss trend.
The next phase will focus on field deployment and expanded validation across land and deep-water operations, incorporating feedback from service-company and operator trials. Further development will focus on model-assisted event detection and its integration with conventional volume-based criteria, with the objective of improving detection sensitivity and response time while reducing false alarms.
Further details about the developed model and application validation within Callerio et al. (2026b, 2026a, 2025).
References
Callerio, Santiago, Ashok, P., van Oort, E., and Kvalo, M. 2025. Virtual Trip Tank Auto-Calibration: Next-Generation Tripping Event Detection for Managed Pressure Drilling (MPD) Operations. Paper presented at the IADC/SPE Managed Pressure Drilling & Underbalanced Operations Conference & Exhibition, Mexico City, Mexico. IADC/SPE-228373-MS. https://doi.org/10.2118/SPE-228373-MS.
Callerio, S., Kanter, N., Al Kharsa, K., Ashok, P., van Oort, E., and Kvalo, M. 2026a. Field Deployment of an Auto-Calibrated Virtual Trip Tank. Paper presented at the IADC/SPE Managed Pressure Drilling & Underbalanced Operations Conference & Exhibition, London, United Kingdom. https://doi.org/10.2118/233723-MS.
Callerio, S., Shawcross, J., Kanter, N., Ashok, P., van Oort, E., and Kvalo, M. 2026b. Enhanced MPD Well Control Through Virtual Trip Tank (VTT) Calibration. Paper presented at the IADC/SPE International Drilling Conference and Exhibition, Galveston, Texas, USA. IADC/SPE-230687-MS. https://doi.org/10.2118/230687-MS.
Gillard, M., Bhatti, M. A., and Atchison, B. 2022. Global Well Control Database Analysis. Document Number SATECR072, Revision Issue Date.